

New Chart Library: Scaling Analytics & User Autonomy
netlex CLM

My role
UX/UI Design, User Research, Wireframing, Prototyping and Usability Testing
Team members
Thais Muchon (Product Manager),João Lima (Tech Lead),Gustavo Souza (Developer)
Tools
Figma, Miro, Mixpanel
The new chart and dashboard template library replaced the previous chart system, which was originally designed only to generate graphs from templates for legacy platform clients.
By restructuring the information architecture, we expanded the library from 12 to 61 chart types and introduced 7 dynamic dashboard templates to support advanced enterprise data analysis.
Project duration: 1 month and 25 days
Challenge
The previous experience within netLex's data intelligence module provided low autonomy for end-users when creating charts and dashboards. Consequently, this limitation created a heavy dependency on the internal team to generate essential reports.
Simultaneously, the legacy chart library lacked support for next-generation data types. This constraint restricted its overall usage and prevented the platform from expanding its analytical capabilities.
Legacy System Limitations Data Constraint
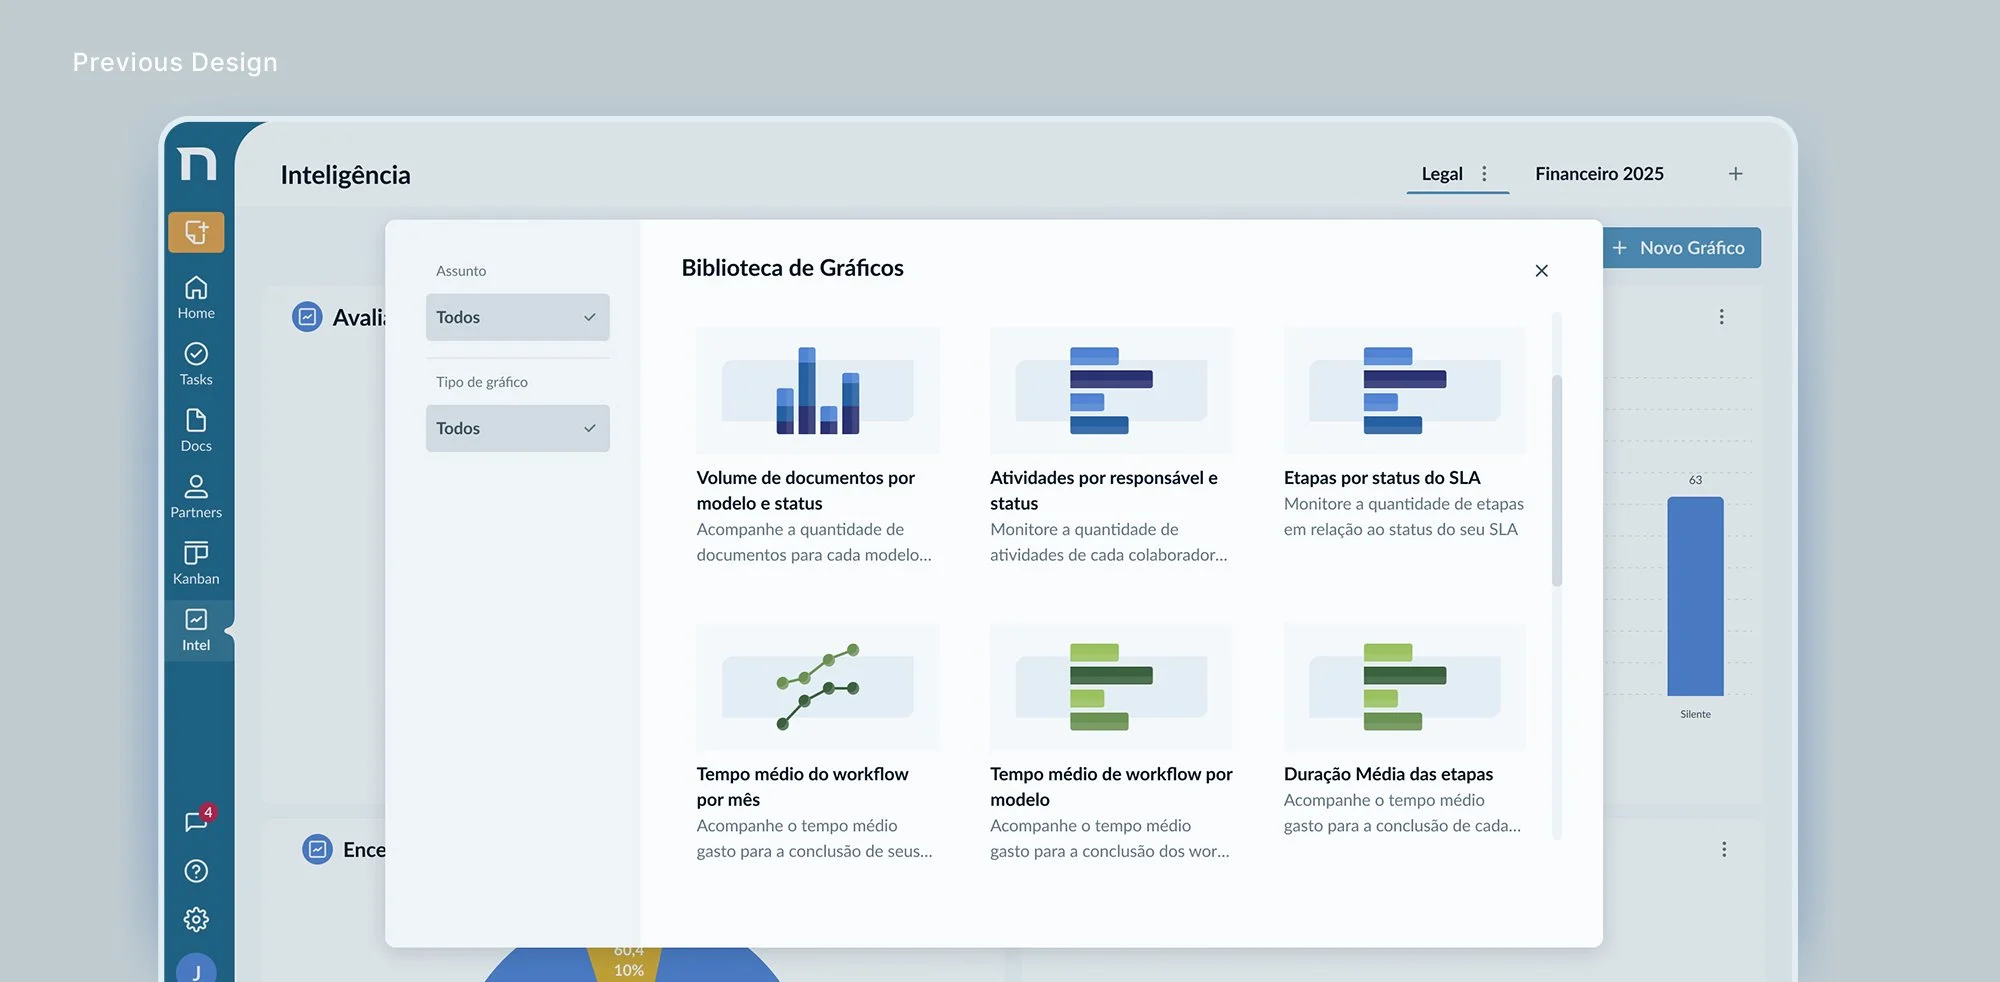
Limited content
The library was limited at 12 legacy charts, failing to support modern data-scenarios
Ineffective filters
Deep functional issues made filtering ineffective, forcing the UI to display all parameters without true segmentation.
Inconsistent visual identity
Colors lacked semantic consistency, functioning as decorative assets rather than cognitive data indicators.
Qualitative Research
Key insights
Charts work for classic clients, but not for next-gen clients.
Users faced friction understanding how chart properties and filters work together to build charts.
Transitioning from single-chart rendering to an end-to-end dashboard creator was an internal, proactive business decision to achieve operational scale, mitigating future engineering requests rather than reacting to user feature requests.
“When creating charts, we know the basics, but when we try something more detailed, we get lost.”
Stakeholder
“Clients struggle to understand which properties to use and how to drag them to build the charts they want.”
netlex Customer Sucess
Old and new flow
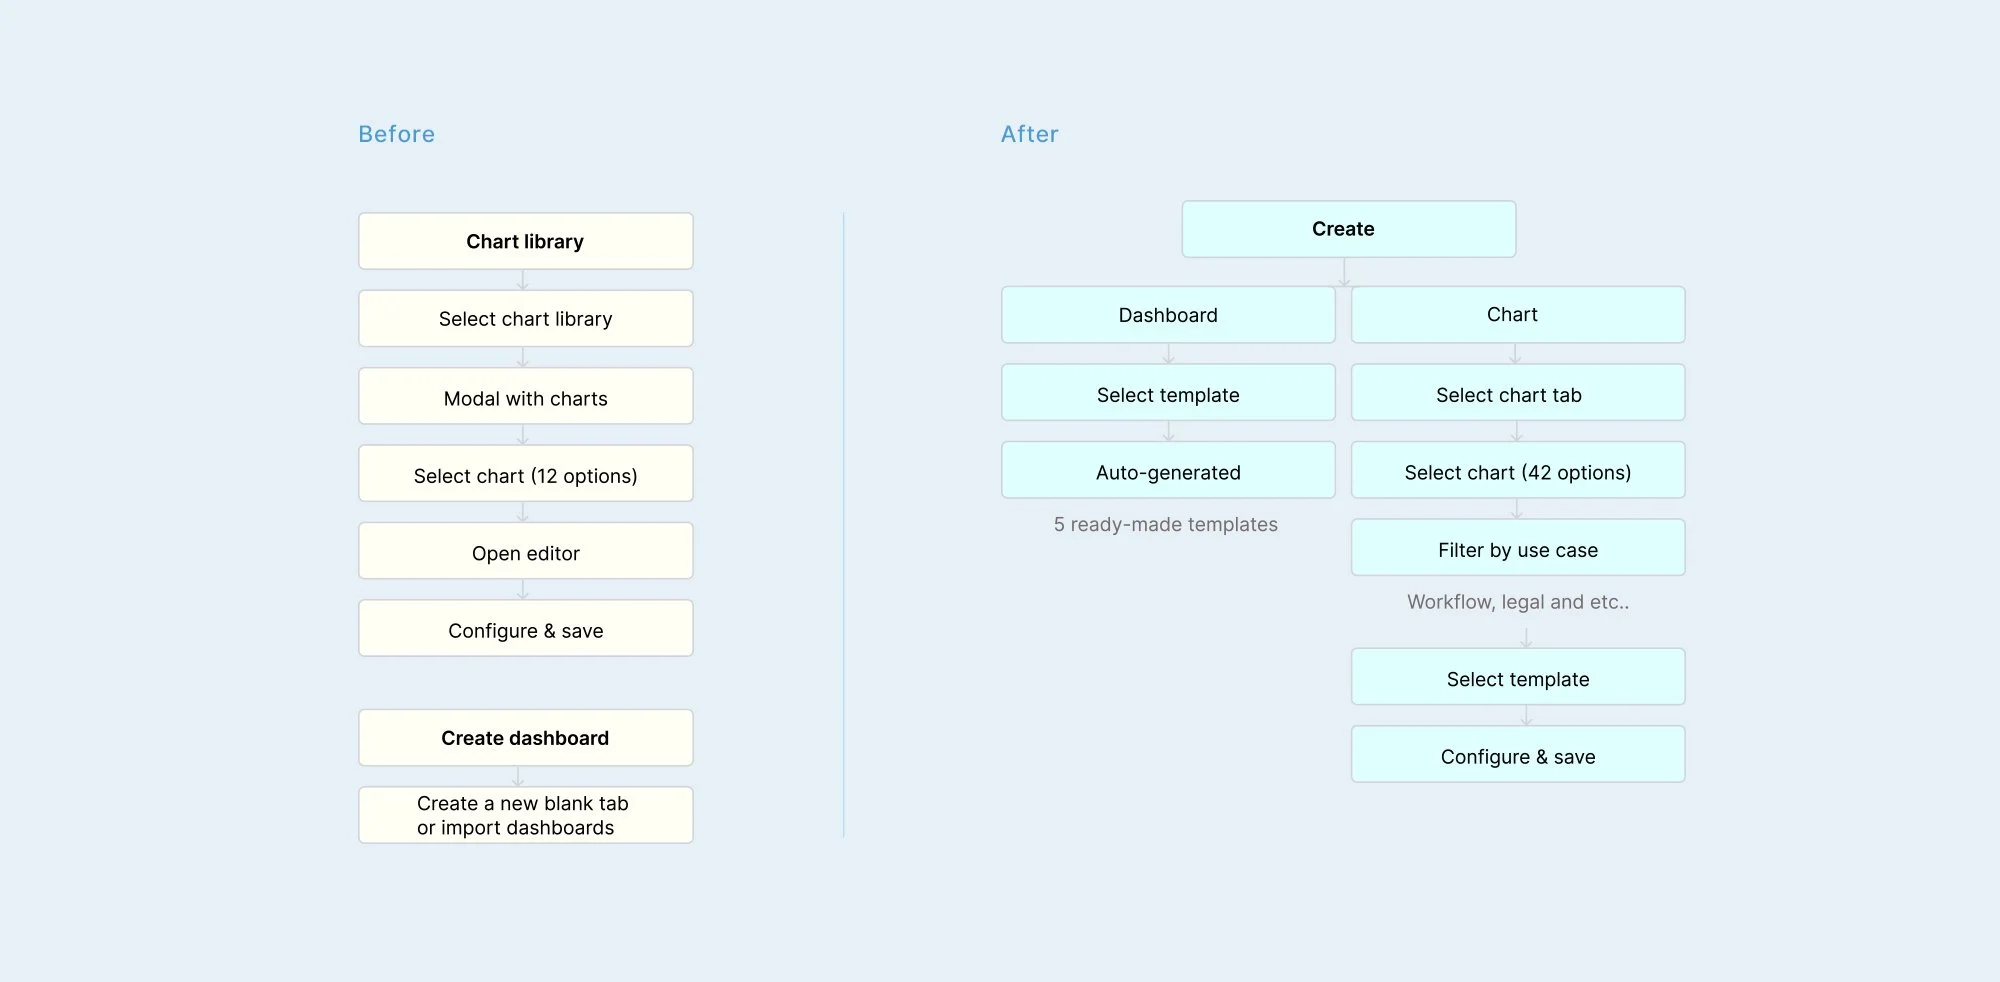
Product Decision
The introduction of full dashboard creation was a strategic, business-driven decision, focused on efficiency and scalability rather than an explicit user demand.
Usability testing
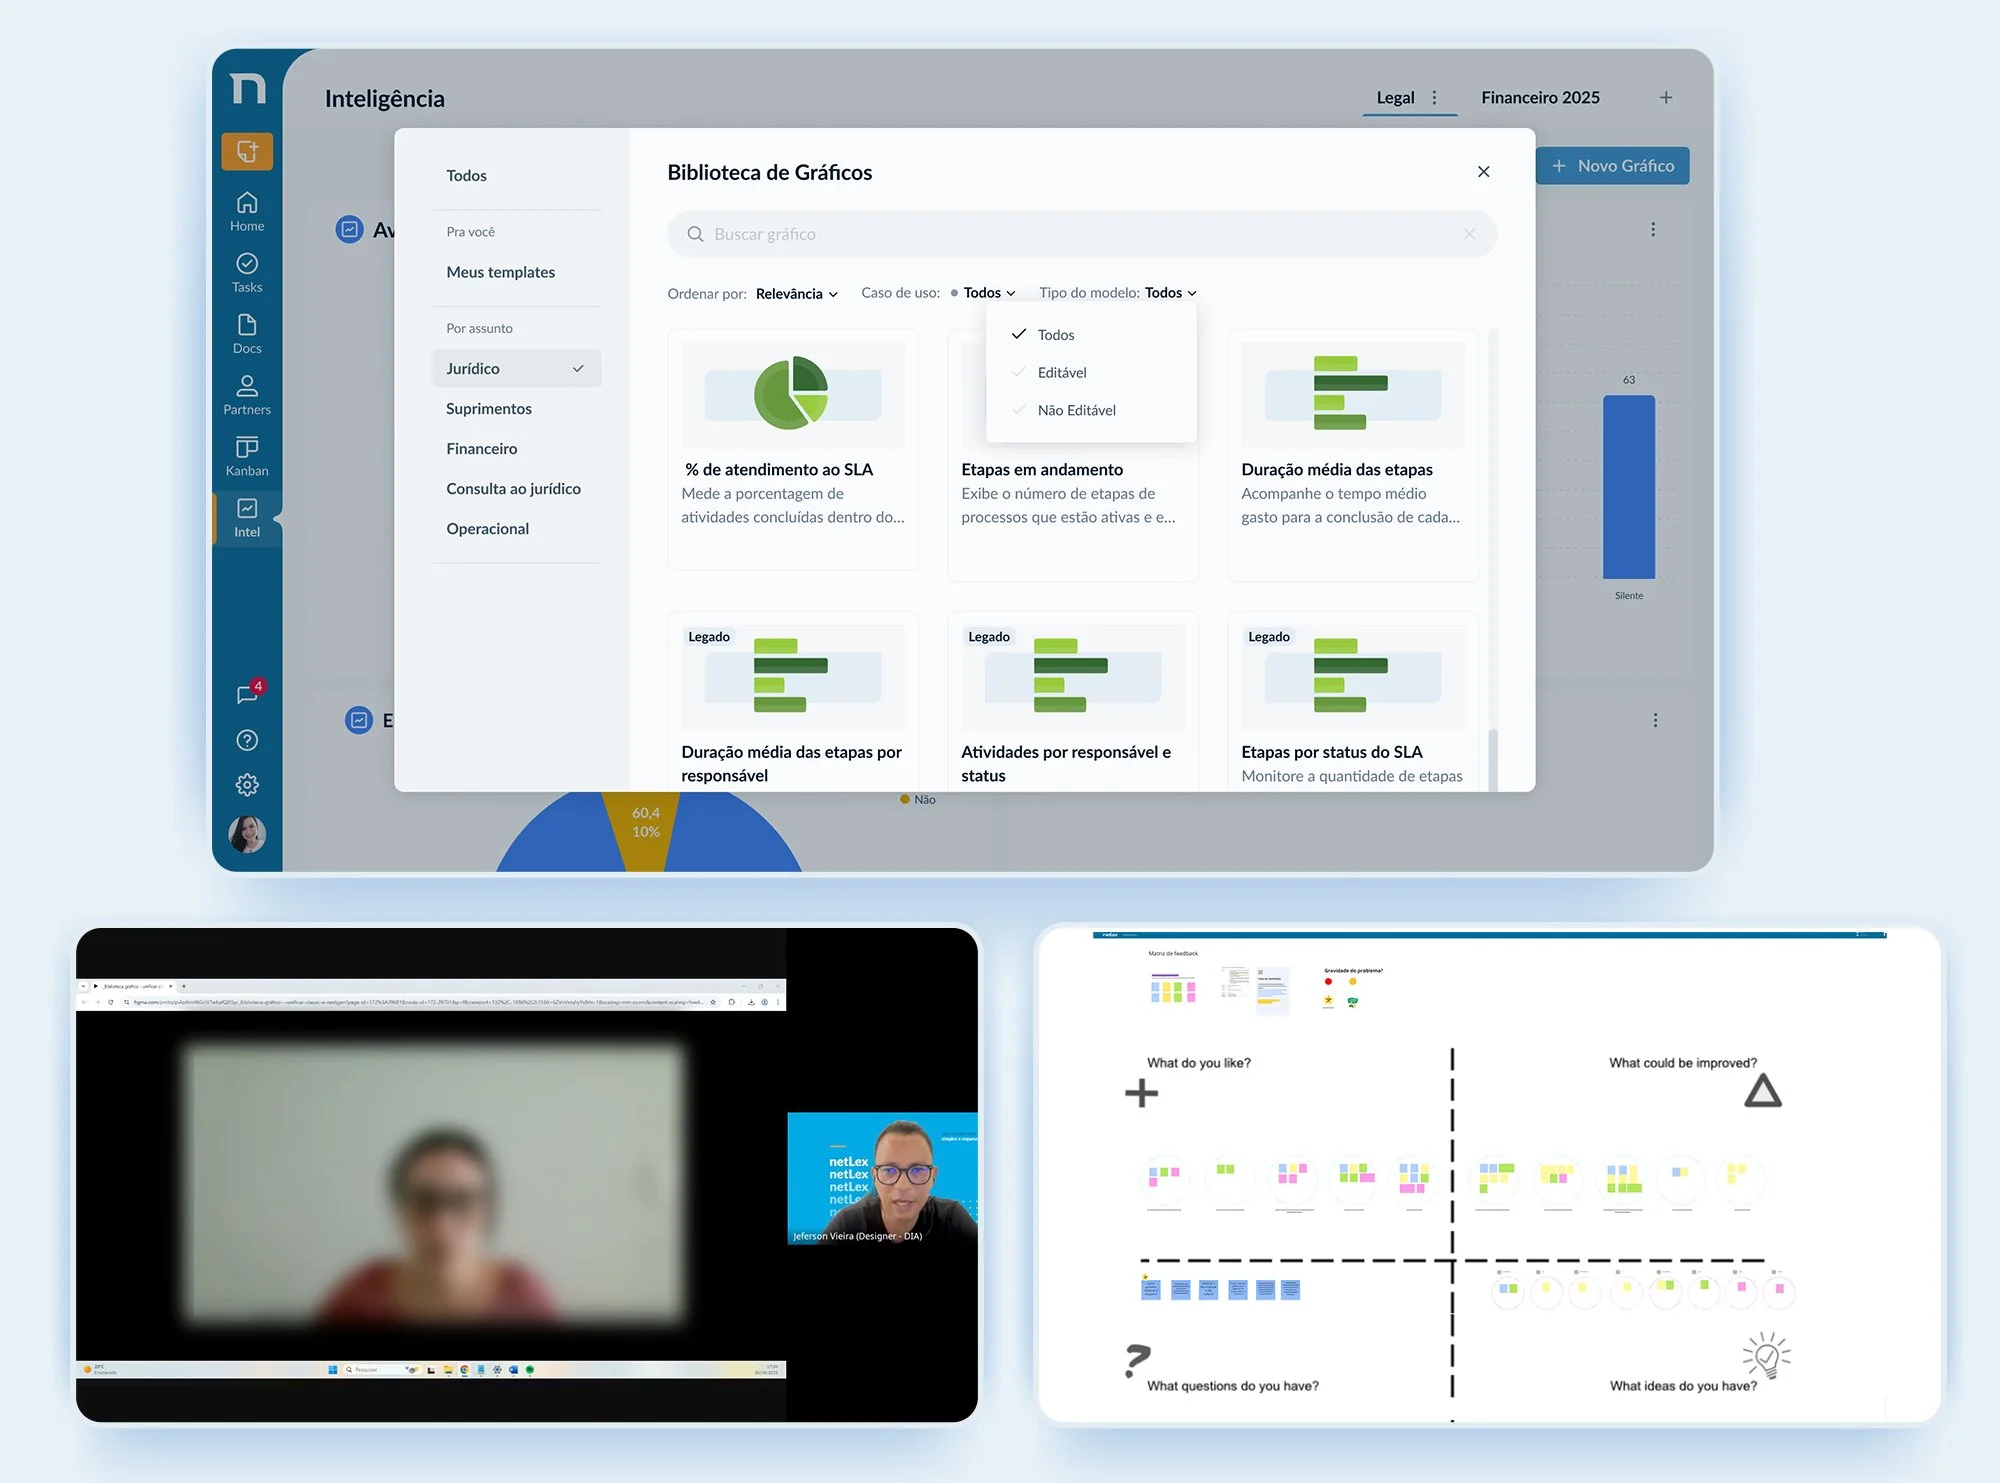
Dual Navigation Issues
Having a sidebar that categorized by subject and use case caused confusion. Testing proved that the use case was much more relevant.
We ran usability tests focused on the chart library to understand how users were navigating, selecting, and configuring visualizations, and where friction was getting in the way
Removing the sidebar opened up the canvas
Removing the sidebar freed up screen space.. Less navigation elements meant more room to display charts and dashboards, making the library easier to scan at a glance.
"Editable / non-editable"(Label Ambiguity)
"Editable/Non-editable" labels caused confusion. While meant to reflect the Classic vs. NextGen data separation, users found them ambiguous. We removed these labels in favor of a unified, cleaner experience.
New Design
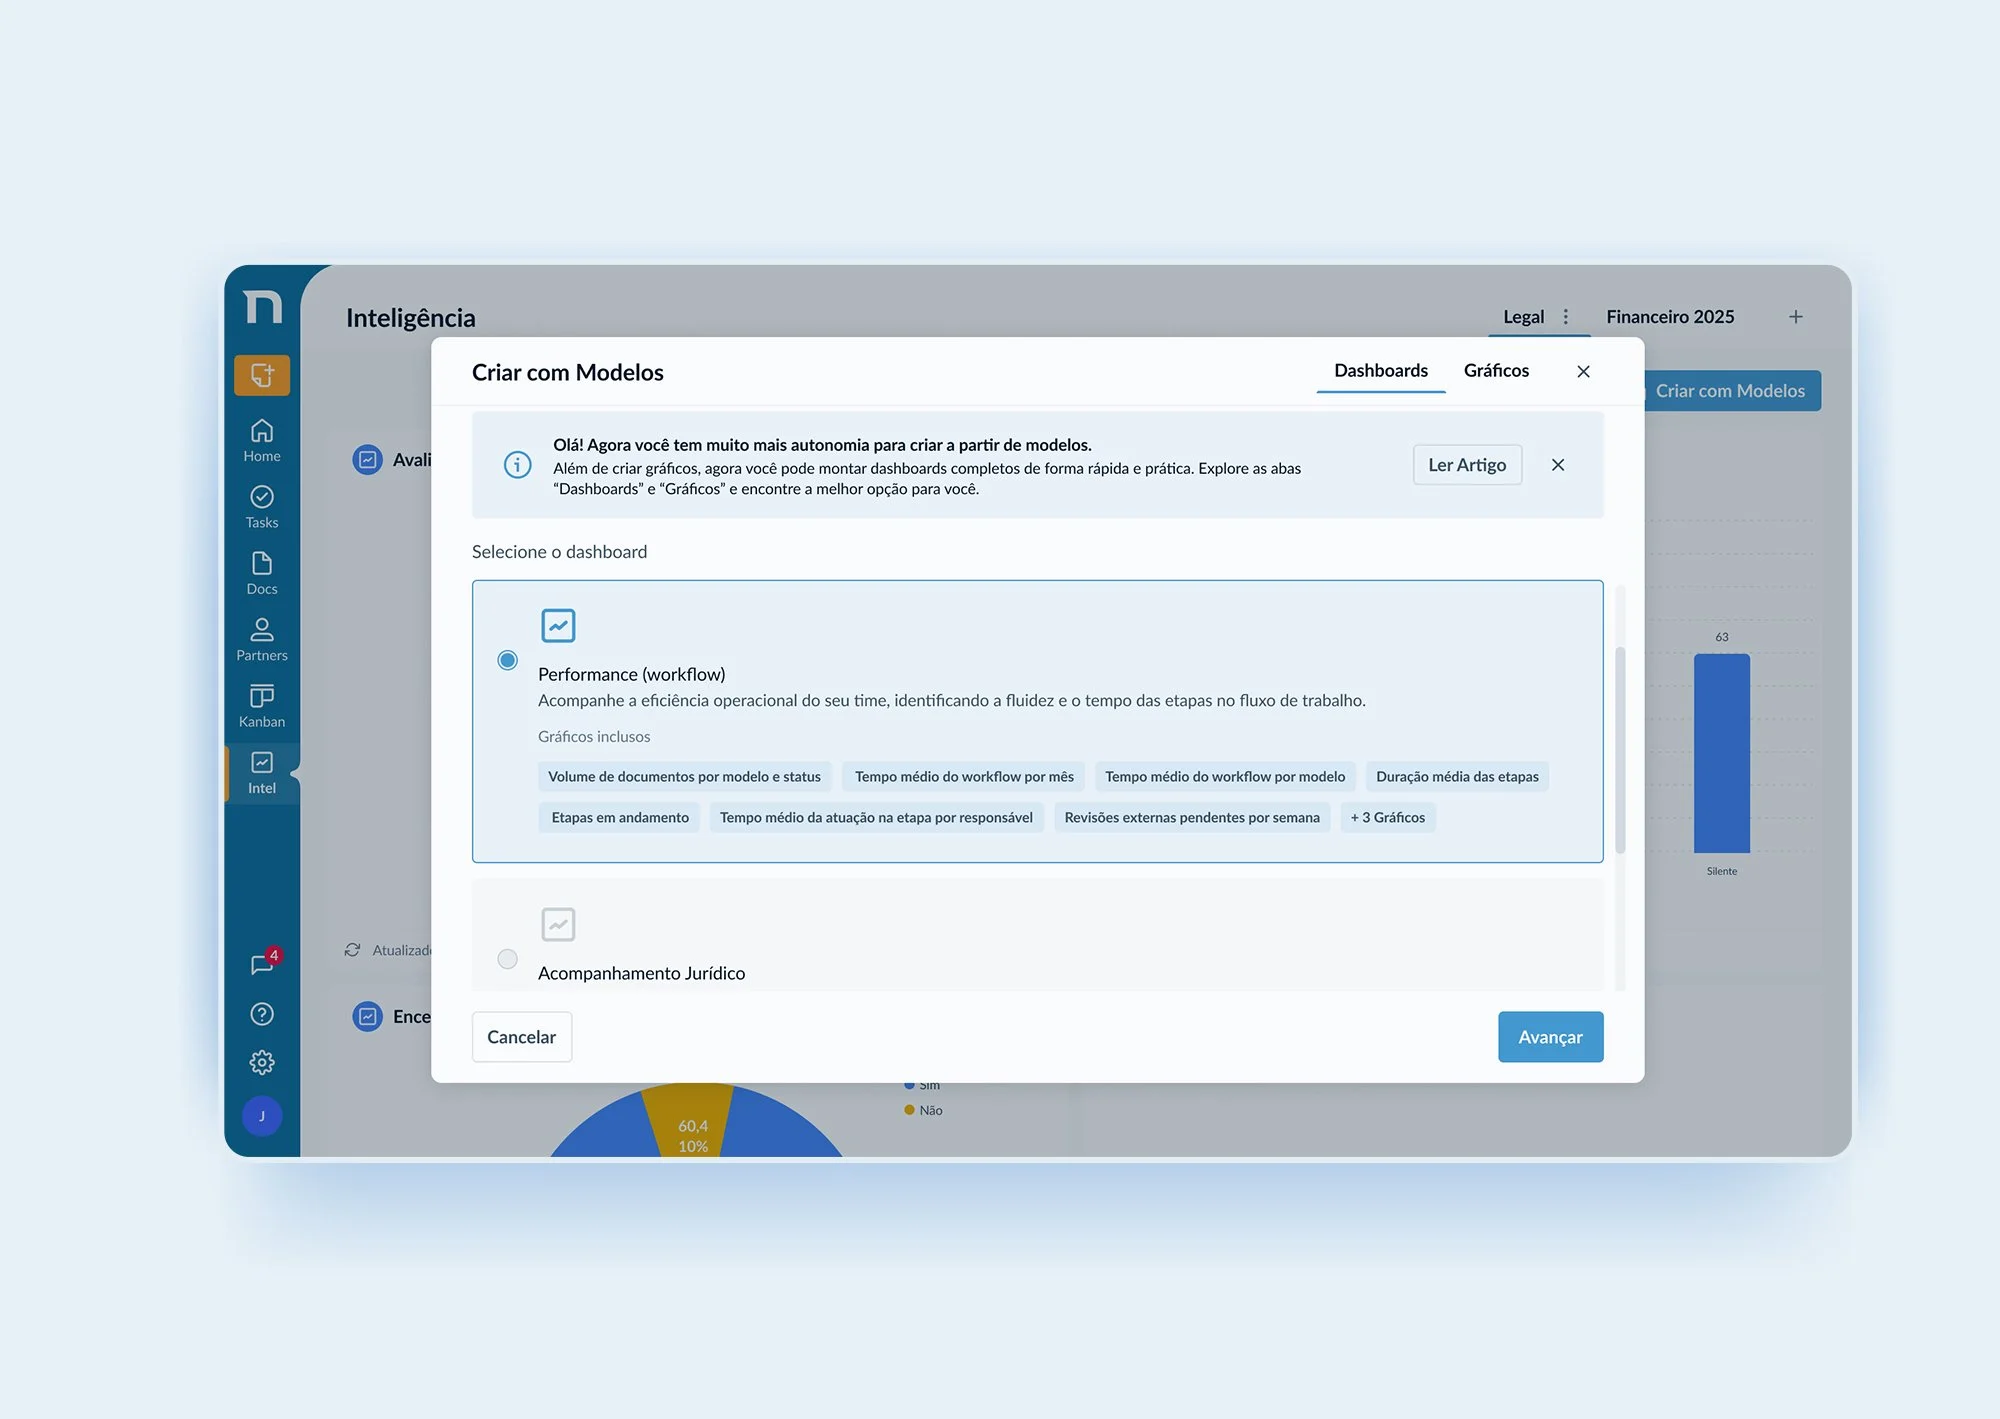
User Autonomy
The new interface allows users to quickly create charts and dashboards independently, removing the need for support from the internal team.
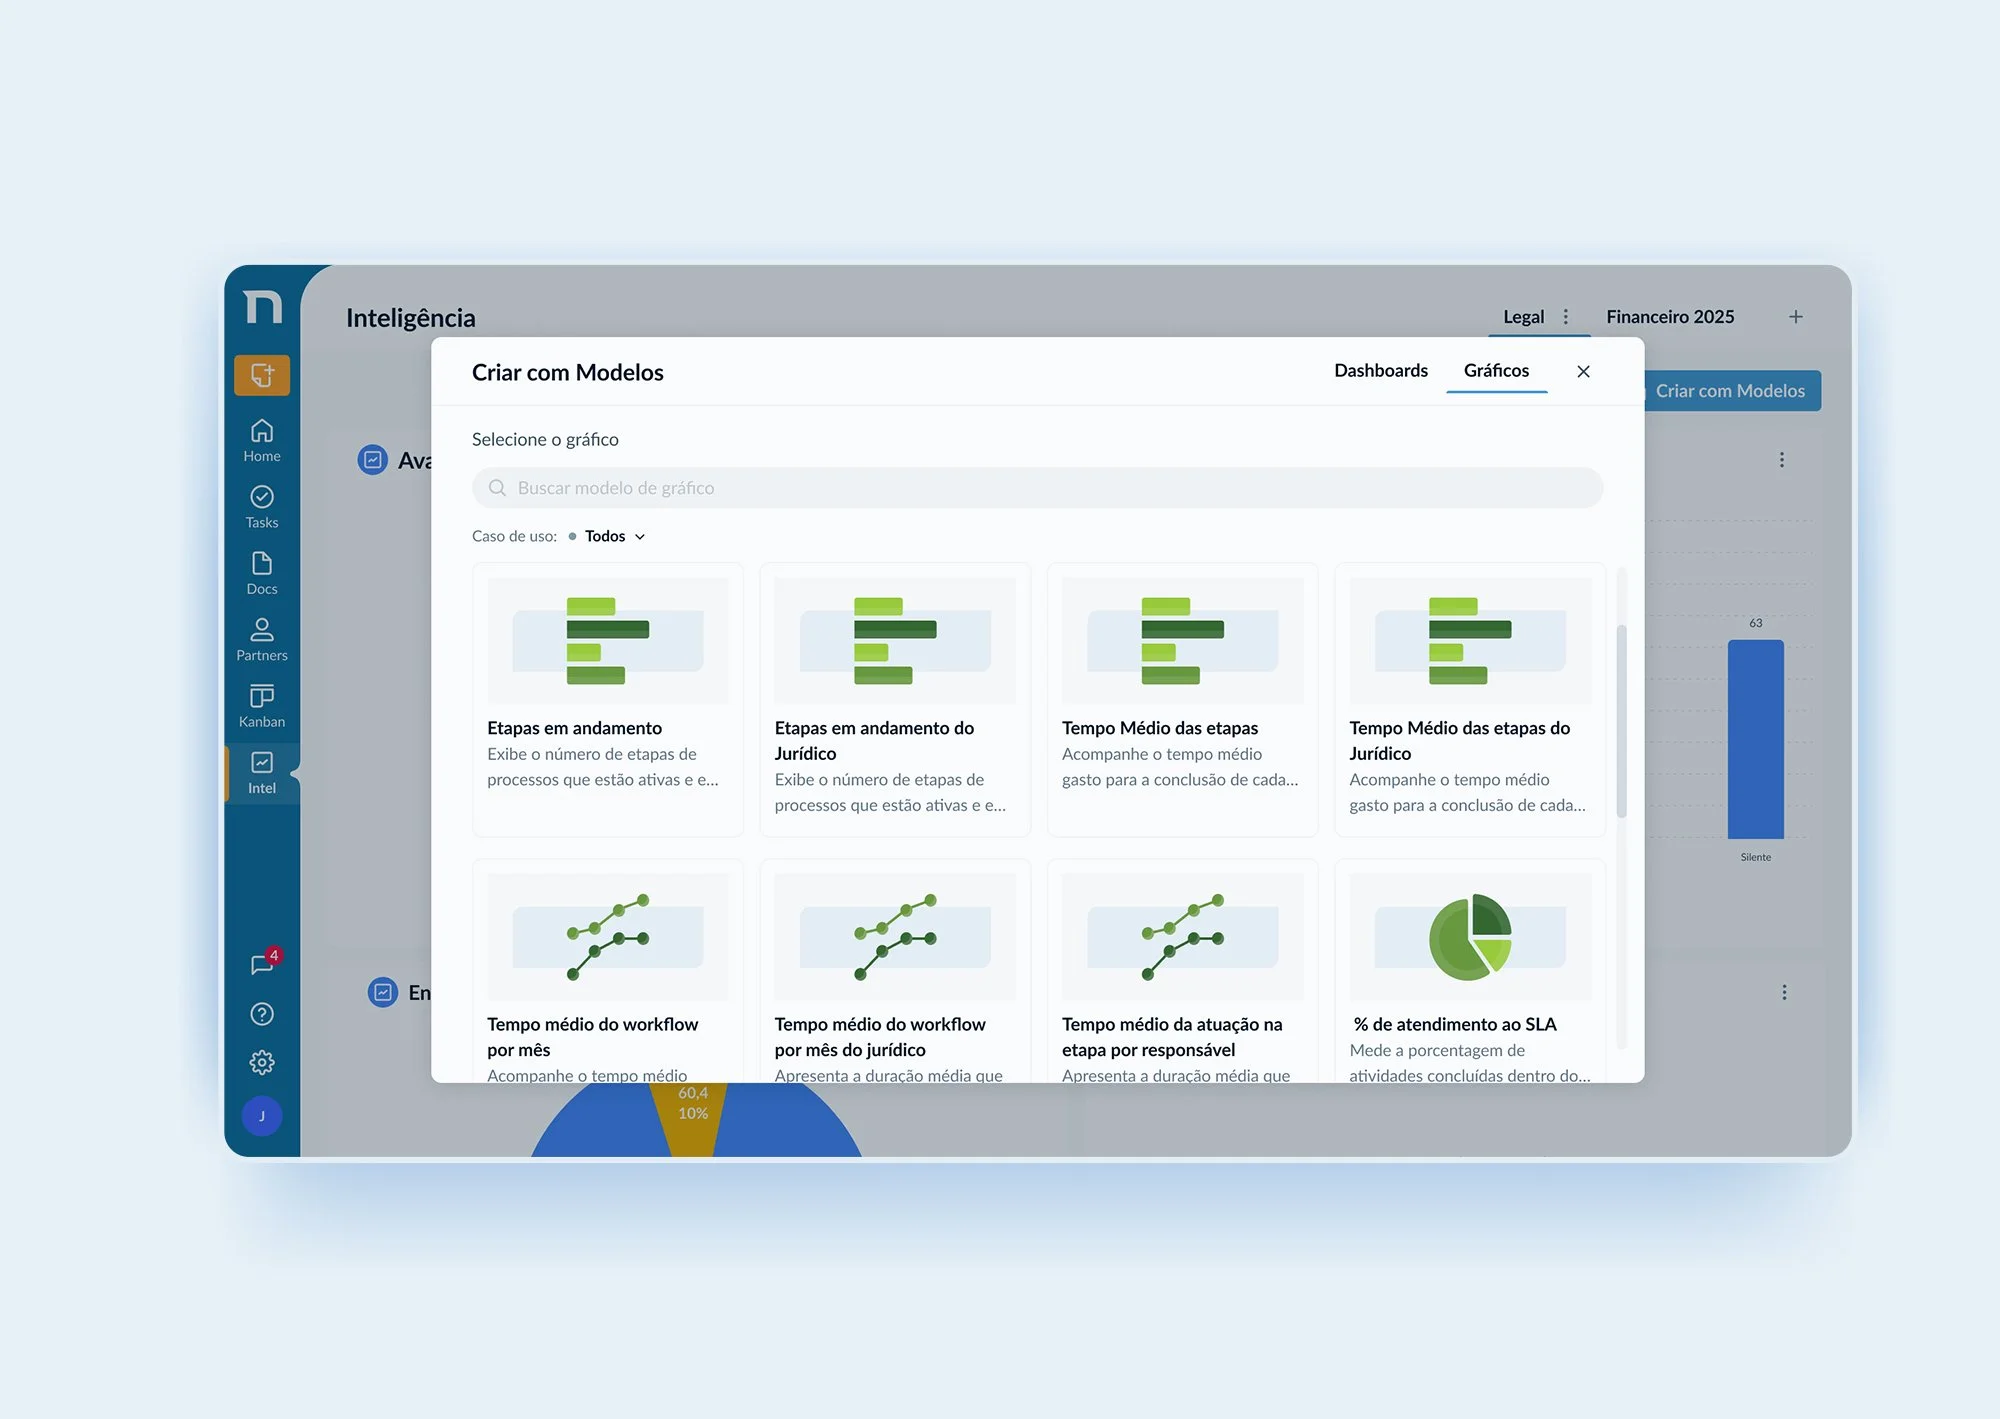
Ready-to-use templates
Templates are organized by use cases to make data analysis easier, covering: Workflows (Efficiency), Documents (Volume), Activities, Signatures, and Legal.
Unified Design
The library was designed for both legacy and next-gen users, ensuring consistency across the platform.
Real impact
Increased Engagement and Adoption
After the launch, library usage increased by approximately 73%, showing higher feature adoption and better user autonomy.
Learnings
Research-driven decisions
Mental model mapping and usability testing were essential to simplify the user experience.
Adaptability during the process
The idea of enabling full dashboard creation emerged during development, requiring scope adjustments and reprioritization.
Cross-functional collaboration
Strong alignment between design, engineering, and product (including the design chapter) was key to delivering a cohesive and scalable solution.